
How to Build an AI Market Intelligence Dashboard with Real-Time News Data
Quick Answer: This tutorial shows you how to build a full-stack AI-powered market intelligence dashboard using the NewsDataHub API and OpenAI GPT-4. You’ll create an application that aggregates real-time news, generates AI summaries, analyzes sentiment, and produces professional PDF reports—all in TypeScript with React and Express.
Perfect for: Developers building news aggregation tools, market intelligence platforms, or AI-powered data analytics dashboards.
Time to complete: 30-45 minutes Difficulty: Intermediate Stack: TypeScript, React 18, Express, OpenAI, NewsDataHub API
What You’ll Build
Section titled “What You’ll Build”
You’ll create a market intelligence dashboard that:
- Aggregates real-time news from thousands of sources using NewsDataHub API
- Generates AI-powered summaries with OpenAI GPT-4o-mini
- Analyzes sentiment across media coverage (positive/neutral/negative)
- Visualizes geographic trends with interactive maps
- Detects timeline spikes to identify breaking news moments
- Exports professional PDF reports for stakeholders
- Works with free API tiers (includes demo mode)
Quick Start - Try It Now
Section titled “Quick Start - Try It Now”You can spin up this application immediately without any API keys using demo mode:
# Clone the repositorygit clone https://github.com/newsdatahub/ai-market-intelligence-dashboard.gitcd ai-market-intelligence-dashboard
# Copy environment filescp backend/.env.example backend/.envcp frontend/.env.example frontend/.env
# Start with Docker (no API keys needed for demo)docker compose up
Navigate to http://localhost:5173 and enter this demo topic in the search bar:
"artificial intelligence"-demoThe dashboard will instantly display:
- Topic analysis with charts and metrics
- AI-generated news brief
- Timeline insights (pre-generated)
- Regional coverage analysis (pre-generated)
All demo responses are pre-cached JSON files. No API keys, no network requests, no quota consumed.
Moving to Live Data
Section titled “Moving to Live Data”To use live data with your own queries:
- Get your free NewsDataHub API key at newsdatahub.com/login
- Get your OpenAI API key at platform.openai.com/api-keys
- Add both keys to
backend/.env:
NEWSDATAHUB_API_KEY=your_newsdatahub_key_hereOPENAI_API_KEY=your_openai_key_here- Restart the application:
docker compose restart - Search any topic: “quantum computing”, “climate tech”, “semiconductor industry”
Prerequisites
Section titled “Prerequisites”Required Tools
Section titled “Required Tools”- Docker (latest stable version)
- Docker Compose (v2.0+)
- Git
API Keys (for live data)
Section titled “API Keys (for live data)”- NewsDataHub API key - Get free key
- OpenAI API key - Get key
For current API quotas and pricing, visit newsdatahub.com/plans.
Knowledge Prerequisites
Section titled “Knowledge Prerequisites”- Basic TypeScript/JavaScript
- Familiarity with React hooks
- Basic Express.js concepts
- Understanding of REST APIs
Project Architecture
Section titled “Project Architecture”Technology Stack
Section titled “Technology Stack”Backend:
- Node.js + Express + TypeScript
- NewsDataHub integration for article fetching
- OpenAI integration for report generation
- Topic analysis service for sentiment and aggregation
- TTL-based caching service
- AI report service for executive summaries
Frontend:
- React 18 + TypeScript + Vite
- Plotly.js for interactive charts
- Leaflet for geographic maps
- React PDF for report exports
Data Flow
Section titled “Data Flow”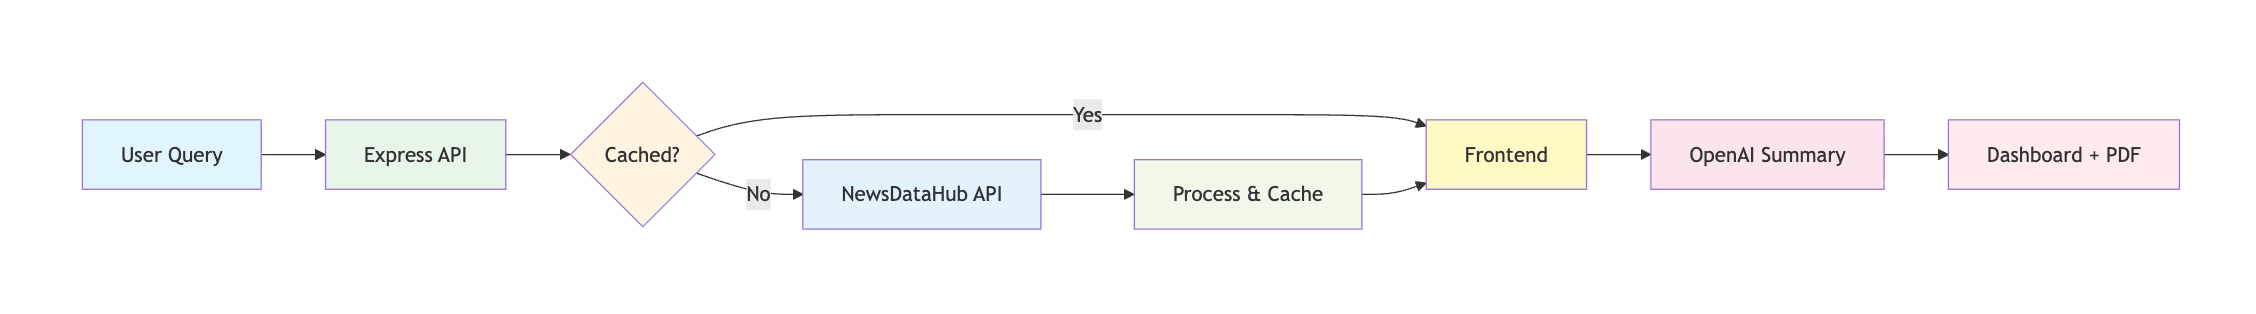
- User enters query in React dashboard
- Express API checks cache (1h-24h TTL)
- If not cached, fetches from NewsDataHub API
- Backend processes articles for sentiment, geography, keywords
- Results cached and returned to frontend
- OpenAI generates executive summaries on demand
- Frontend renders visualizations and reports
- Users export to PDF with embedded charts
Key Features Explained
Section titled “Key Features Explained”1. News Aggregation with Smart Caching
Section titled “1. News Aggregation with Smart Caching”The backend fetches articles from NewsDataHub and implements intelligent caching to minimize API calls:
- Current-day queries cached for 1 hour
- Historical queries cached for 24 hours
- Cache keys based on topic + filters
- Reduces API usage by 80%+ for repeated queries
How pagination works: The application fetches articles in batches of 100 (free tier limit), using the next_cursor parameter for pagination. It deduplicates by article ID to ensure unique results.
2. AI-Powered Executive Summaries
Section titled “2. AI-Powered Executive Summaries”OpenAI GPT-4o-mini generates structured intelligence reports with:
- Key Developments (bullet points)
- Media Tone & Bias (sentiment analysis)
- Geographic Highlights (regional patterns)
- Strategic Insights (actionable takeaways)
The prompts are designed for factual, concise output suitable for business stakeholders.
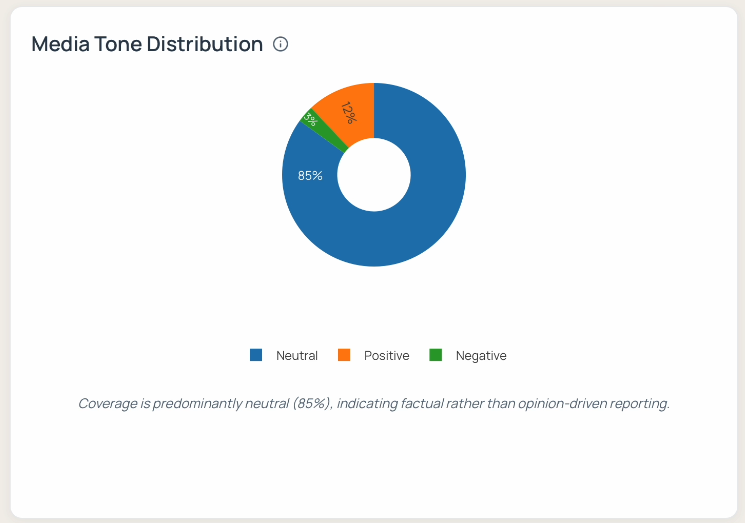
3. Sentiment Analysis
Section titled “3. Sentiment Analysis”The application uses keyword-based sentiment scoring with approximately 70-80% accuracy. For production applications, consider integrating ML models like VADER or fine-tuned BERT for 90%+ accuracy.
Free tier limitation: Sentiment analysis requires paid NewsDataHub plans, as the free tier does not include sentiment metadata. The demo mode shows the full sentiment analysis experience.
4. Geographic Visualization
Section titled “4. Geographic Visualization”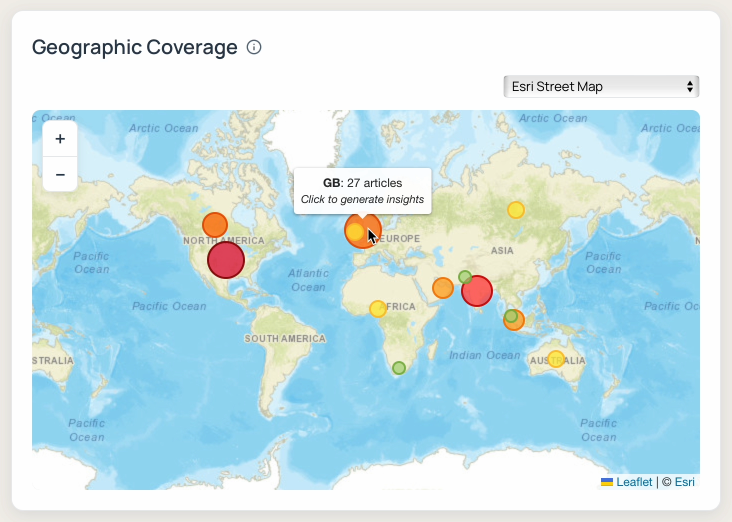
Interactive world map using Leaflet displays article distribution by source country. Circle markers are sized proportionally to article count, providing instant visual insight into geographic coverage patterns.
Free tier limitation: Geographic features require paid plans. Free tier users see this feature blurred with upgrade prompts.
5. Timeline Spike Detection
Section titled “5. Timeline Spike Detection”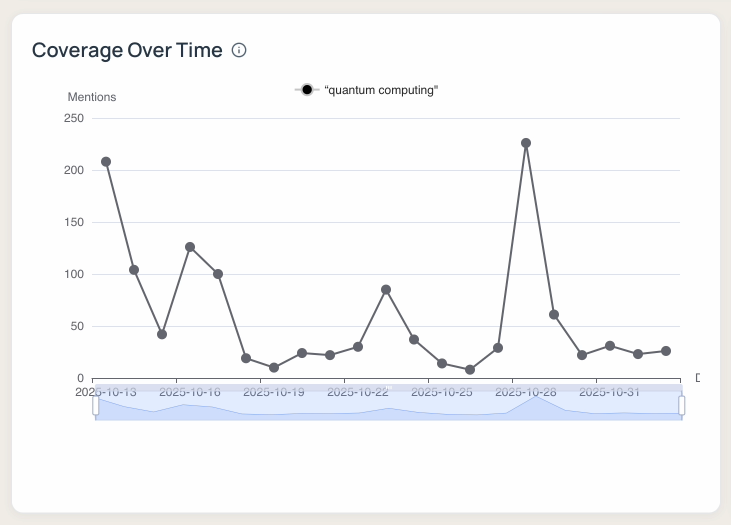
The dashboard analyzes daily article volume to identify significant coverage spikes. Clicking a spike date generates a focused AI report explaining what happened that day.
Free tier limitation: Timeline features require paid plans.
6. PDF Report Generation
Section titled “6. PDF Report Generation” Export professional reports using @react-pdf/renderer
Customizing AI Prompts
Section titled “Customizing AI Prompts”The AI reports are generated using customizable prompts in backend/src/utils/promptUtils.ts. You can modify these to fit your specific use case.
Main Intelligence Report Prompt
Section titled “Main Intelligence Report Prompt”Located in createIntelligenceReportMessages():
Default prompt structure:
`Analyze these ${articleCount} news articles about "${topic}".
Provide a concise intelligence brief with:1. Key Developments (3-4 bullets)2. Media Tone & Bias3. Geographic Highlights4. Strategic Insights`
Customization suggestions:
For financial analysis:
`Analyze these ${articleCount} articles about "${topic}".
Provide:1. Market Impact (3-4 bullets)2. Investor Sentiment3. Risk Factors4. Price Drivers5. Competitive Dynamics`
For competitive intelligence:
`Analyze coverage of "${topic}".
Provide:1. Competitive Moves (what competitors are doing)2. Market Positioning3. Product/Service Announcements4. Strategic Partnerships5. Market Share Indicators`
For crisis monitoring:
`Analyze news about "${topic}".
Provide:1. Incident Summary2. Stakeholder Impact3. Response Actions Taken4. Media Sentiment Trajectory5. Recommended Monitoring Focus`
Timeline Report Prompt
Section titled “Timeline Report Prompt”Located in createTimelineReportMessages():
Default: Explains why coverage spiked on a specific date.
Customization for event tracking:
`On ${date}, coverage of "${topic}" increased significantly.
Analyze:1. Primary Event/Announcement2. Key Players Involved3. Immediate Market Reaction4. Follow-on Developments5. Long-term Implications`
Regional Report Prompt
Section titled “Regional Report Prompt”Located in createRegionalReportMessages():
Default: Analyzes country-specific coverage patterns.
Customization for market entry analysis:
`Analyze ${country} coverage of "${topic}".
Provide:1. Market Conditions2. Regulatory Environment3. Local Competition4. Consumer Sentiment5. Entry Barriers/Opportunities`
Adjusting Report Tone and Length
Section titled “Adjusting Report Tone and Length”In promptUtils.ts, you can adjust:
Temperature parameter (in openaiService.ts):
0.1-0.3- More factual, consistent0.4-0.6- Balanced0.7-1.0- More creative, varied
Length instructions: Add to prompt:
"Keep each section to 2-3 sentences. Total report should be under 300 words."// OR"Provide detailed analysis with 5-7 bullets per section."Output format:
"Format response as valid JSON with keys: keyDevelopments, sentiment, geographic, insights"// OR"Format as markdown with H3 headers for each section"Code Examples
Section titled “Code Examples”Example 1: Basic News Query
Section titled “Example 1: Basic News Query”// Query news about quantum computing (last 14 days)const response = await fetch( `${API_BASE_URL}/api/news/search-topic?topic=quantum%20computing&days=14`);const data = await response.json();console.log(`Found ${data.articles.length} articles`);Example 2: Advanced Boolean Search
Section titled “Example 2: Advanced Boolean Search”NewsDataHub supports AND, OR, NOT operators:
// Complex queryconst query = '("artificial intelligence" OR "machine learning") AND ethics NOT military';const response = await fetch( `${API_BASE_URL}/api/news/search-topic?topic=${encodeURIComponent(query)}`);Example 3: Custom React Hook for Dashboard
Section titled “Example 3: Custom React Hook for Dashboard”export function useNewsSearch() { const [articles, setArticles] = useState<Article[]>([]); const [loading, setLoading] = useState(false); const [error, setError] = useState<string | null>(null);
const search = async (topic: string) => { setLoading(true); try { const response = await fetch( `${API_BASE_URL}/api/news/search-topic?topic=${encodeURIComponent(topic)}` ); const data = await response.json(); setArticles(data.articles); } catch (err) { setError(err.message); } finally { setLoading(false); } };
return { articles, loading, error, search };}- How much does it cost to run this dashboard?
Check current pricing at newsdatahub.com/plans. NewsDataHub offers a free tier for testing. OpenAI costs vary based on usage and model selection.
- Can I use this commercially?
Yes, the code is MIT licensed. Review NewsDataHub and OpenAI terms for commercial API usage.
- How accurate is the sentiment analysis?
The keyword-based approach is approximately 70-80% accurate. For production, integrate ML models like VADER, TextBlob, or fine-tuned BERT for 90%+ accuracy.
- Does it support languages other than English?
Yes. NewsDataHub supports 80+ languages. Modify the language parameter in queries. This tutorial filters to English for consistent sentiment analysis.
- How is caching implemented?
In-memory TTL cache: 1 hour for current-day queries, 24 hours for historical data. For production at scale, replace with Redis for persistence across server restarts.
- Can I change the AI model?
Yes. Edit backend/src/services/openaiService.ts to switch from gpt-4o-mini to gpt-4, gpt-3.5-turbo, or other models. Adjust temperature and max tokens as needed.
- How do I add more chart types?
Extend components in frontend/src/components/charts/. Plotly.js supports 40+ chart types including heatmaps, sankey diagrams, and more.
- Can I customize the PDF styling?
Yes. Modify the StyleSheet in frontend/src/components/ExportReportPDF.tsx. You can change fonts, colors, layouts, and add your company branding.
- What’s included in the NewsDataHub free tier?
Visit newsdatahub.com/plans for current quotas and limits.
- How many articles can I analyze at once?
The application fetches up to 200 articles per query on free tier (configurable). More articles can be fetched with pagination on paid plans.
- Are articles real-time?
Depends on your plan. Check newsdatahub.com/plans for data freshness by tier.
- Can I filter by political bias?
Yes, with paid plans. NewsDataHub provides source-level political leaning metadata from far-left to far-right.
- What happens if I exceed my API quota?
The application displays a clear error message suggesting demo mode or plan upgrade. No data is corrupted or lost.
- I see “Missing API configuration” error
Add both NEWSDATAHUB_API_KEY and OPENAI_API_KEY to backend/.env, or use demo mode with "artificial intelligence"-demo.
- My topic returns no articles
Try broadening the query (remove quotes or use fewer words), extend the date range to 21 days, or check topic spelling.
- Free tier shows blurred charts
This is expected. Sentiment, timeline, and map features require paid plans as they depend on metadata not included in free tier responses. Use demo mode to see the full experience.
- How do I check if my API keys are working?
Visit http://localhost:3001/api/health after starting the backend. It returns configuration status.